An all-in-one solution simplifying EUDR compliance
RubberWay Geo-Mapping
An all-in-one solution simplifying EUDR compliance
RubberWay Geo-Mapping
An all-in-one solution simplifying EUDR compliance
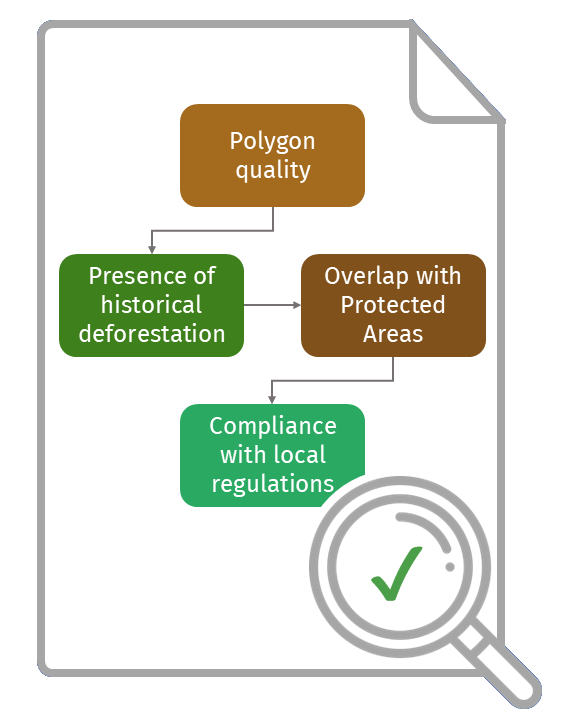
Compliance Checks
RubberWay Geo-Mapping minimizes non-compliance with EUDR through a robust verification process.
Our platform meticulously collects and checks all required information, going beyond simple data gathering. We conduct detailed assessments including detection of historical deforestation, verification of polygon quality, identification of overlaps with Protected Areas, and comprehensive checks on compliance with local regulations for both farmers and plots.
Compliance Checks
Mobile Application.
RubberWay Geo-Mapping minimizes non-compliance with EUDR through a robust verification process.
Our platform meticulously collects and checks all required information, going beyond simple data gathering. We conduct detailed assessments including detection of historical deforestation, verification of polygon quality, identification of overlaps with Protected Areas, and comprehensive checks on compliance with local regulations for both farmers and plots.
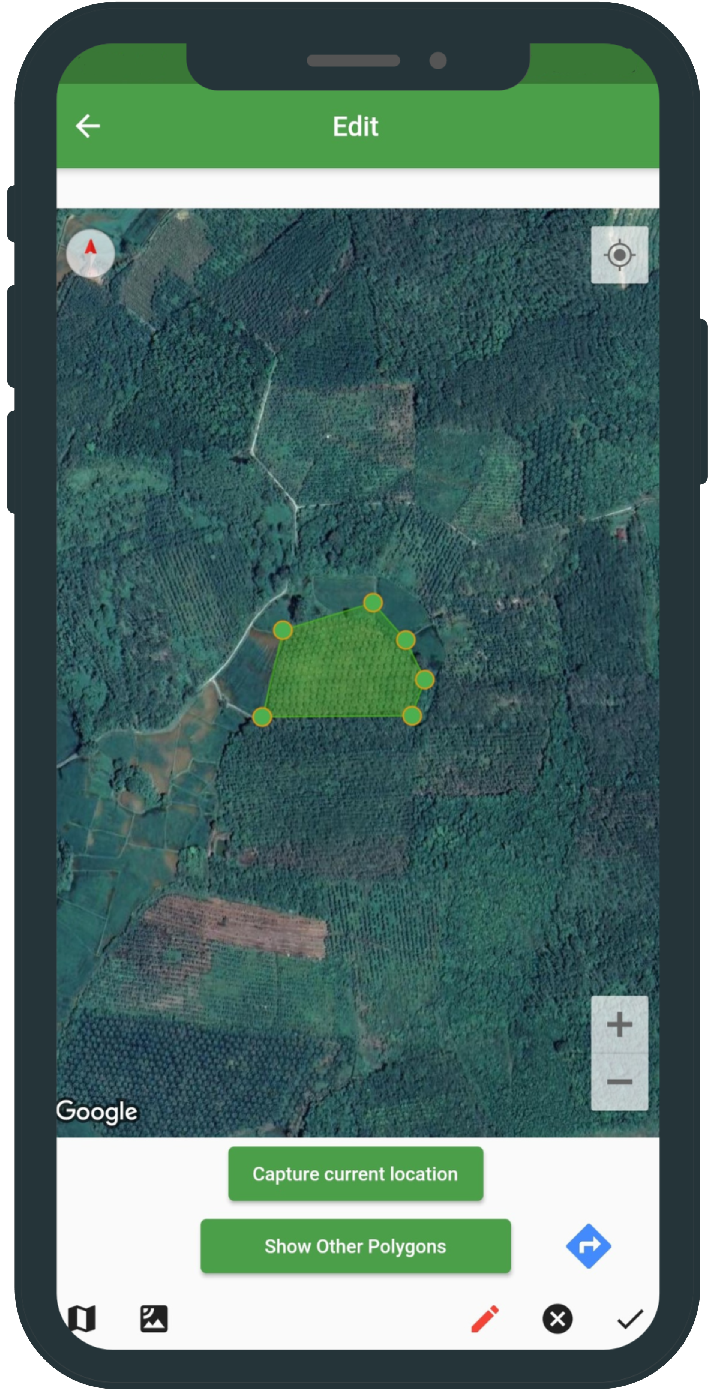
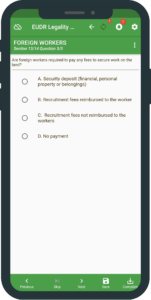
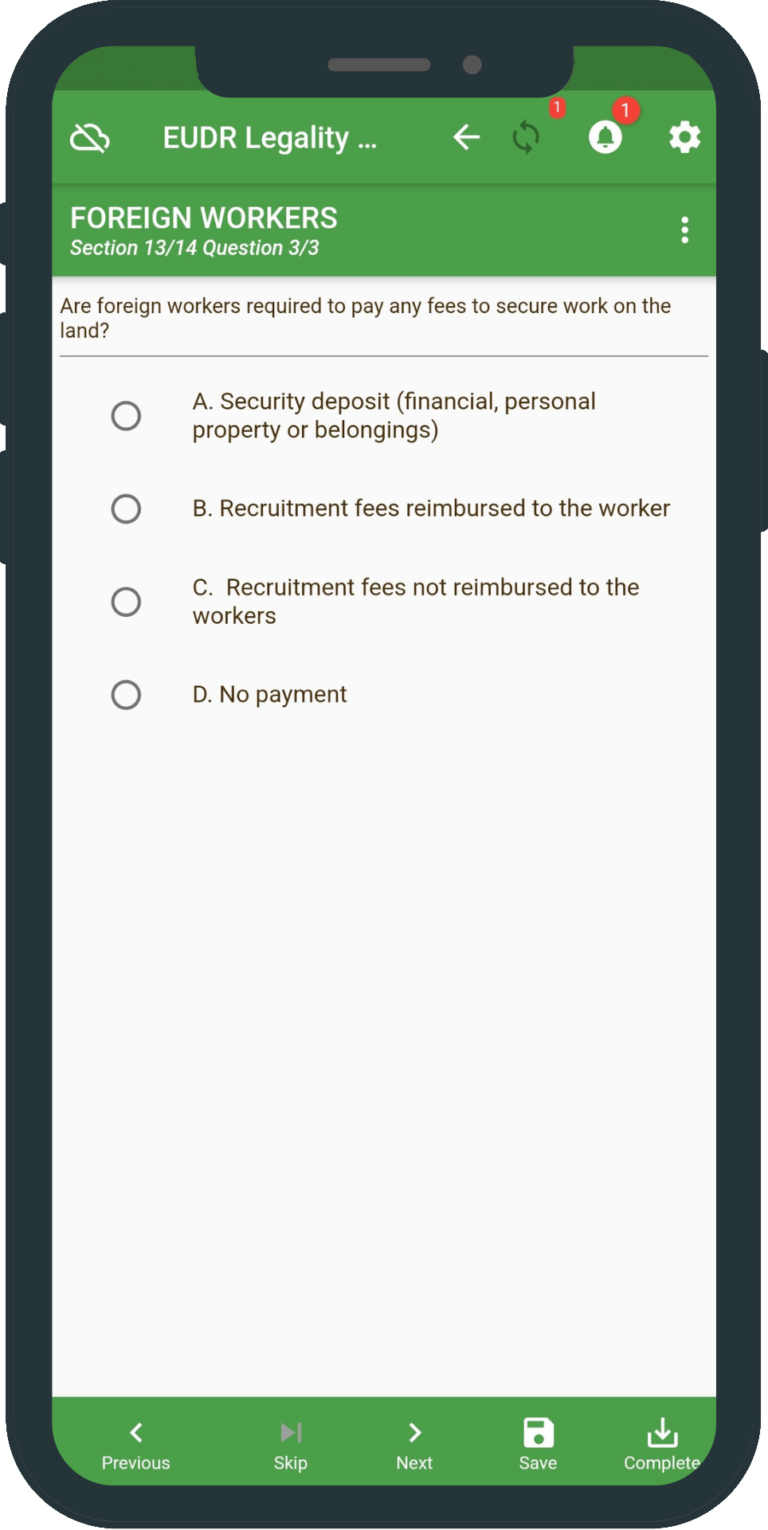
Mobile Application
Our mobile application revolutionizes data collection for natural rubber processing factories. Designed with an intuitive interface, the application enables straightforward information gathering directly from farmers. Recognizing the challenges of working in remote areas, we have engineered the application to function seamlessly offline, ensuring data can be collected even in locations with limited internet connectivity.
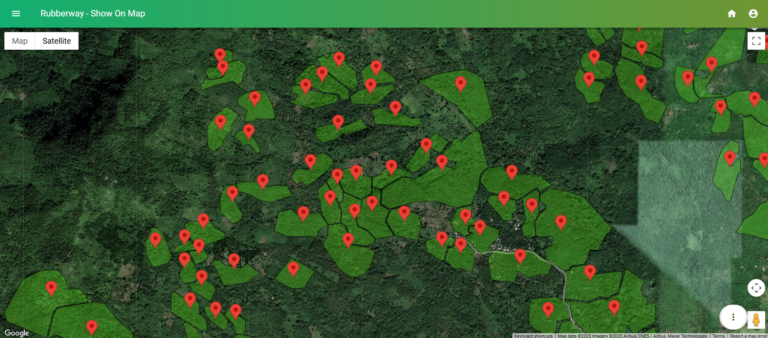
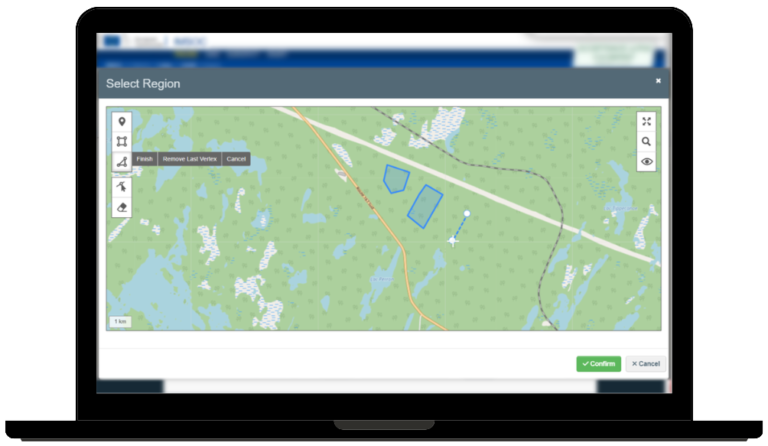
Web Platform
The RubberWay web dashboard serves as a powerful data management and compliance tool. It aggregates all required information, providing a centralized platform for comprehensive data oversight. Compliance checks run seamlessly, allowing users to quickly identify and address potential issues. Users can easily identify farmers or plots that require follow-ups due to incomplete or non-compliant data. This proactive approach allows companies to strategically plan and execute targeted interventions, ensuring that all suppliers in their network meet EUDR standards.
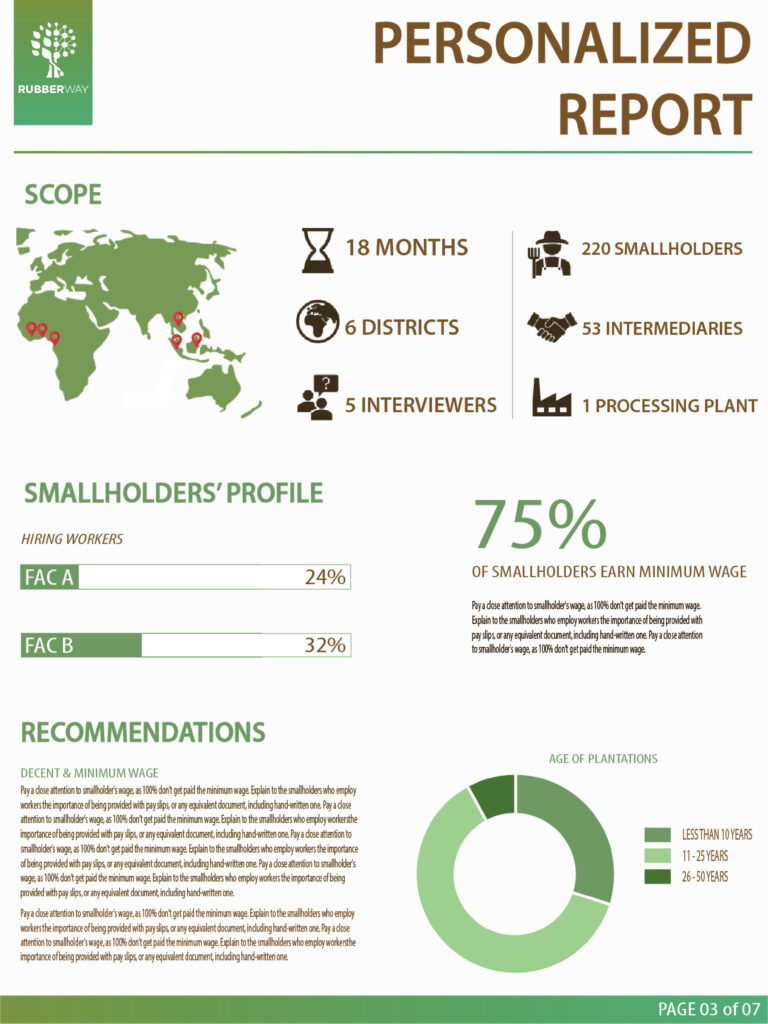
EUDR-Ready Reports
Understanding the complex reporting requirements of the EUDR, RubberWay Geo-Mapping generates precise, submission-ready documentation. Our platform automatically produces essential documents like GeoJSON files and comprehensive Due Diligence Reports, formatted specifically for direct submission to the EU Information System.
Our mobile application revolutionizes data collection for natural rubber processing factories. Designed with an intuitive interface, the application enables straightforward information gathering directly from farmers. Recognizing the challenges of working in remote areas, we have engineered the application to function seamlessly offline, ensuring data can be collected even in locations with limited internet connectivity.
Web Platform
The RubberWay web dashboard serves as a powerful data management and compliance tool. It aggregates all required information, providing a centralized platform for comprehensive data oversight. Compliance checks run seamlessly, allowing users to quickly identify and address potential issues. Users can easily identify farmers or plots that require follow-ups due to incomplete or non-compliant data. This proactive approach allows companies to strategically plan and execute targeted interventions, ensuring that all suppliers in their network meet EUDR standards.
EUDR-Ready Reports
Understanding the complex reporting requirements of the EUDR, RubberWay Geo-Mapping generates precise, submission-ready documentation. Our platform automatically produces essential documents like GeoJSON files and comprehensive Due Diligence Reports, formatted specifically for direct submission to the EU Information System.
All visuals on this page are for illustration purposes only.